





In sports science, the way we assess horizontal deceleration ability is evolving. The Acceleration-Deceleration Ability Test, commonly known as the ADA test, is used to evaluate an athlete’s capacity to rapidly reduce forward velocity after a maximal sprint.
A common assumption is that a longer sprint approach provides a more complete picture of an athlete’s braking capacity. However, recent evidence suggests that approach distance directly influences the mechanical demands of the ADA test, the reliability of certain metrics, and how results should be interpreted.
Shorter approaches, particularly 5 m and 10 m, may provide a more controlled framework for longitudinal monitoring. Meanwhile, kinetic metrics appear to remain more consistent across different approach distances than certain kinematic outcomes, such as stopping time and stopping distance.
In this article, we examine:
- how 5 m, 10 m, and 20 m approach distances affect ADA test results;
- which kinetic and kinematic metrics transfer across protocols;
- the neuromuscular qualities associated with horizontal deceleration;
- and how to standardize the ADA test in high-performance environments.
CONTENTS
1- What Is the Acceleration-Deceleration Ability Test?
2- How Approach Distance Changes Deceleration Demands
3- Which Deceleration Metrics Transfer Across Distances?
4- Neuromuscular Qualities Behind Horizontal Deceleration
5- Practical Takeaways for High-Performance Environments
6- FAQ: Acceleration-Deceleration Ability Test
7- References
1- What Is the Acceleration-Deceleration Ability Test?
The Acceleration-Deceleration Ability test, or ADA test, is designed to assess an athlete’s maximal horizontal deceleration ability. It examines how effectively an athlete can reduce their forward velocity after a maximal linear sprint.
During the test, the athlete accelerates over a predetermined distance, commonly 5 m, 10 m, or 20 m, before decelerating as quickly as possible. Depending on the protocol, the athlete may be instructed to come to a complete stop or backpedal after crossing the designated line to clearly mark the end of the deceleration phase.
Using technologies such as radar or tracking sensors, practitioners can collect several deceleration metrics, including:
- average and peak deceleration;
- time to stop;
- distance to stop;
- horizontal braking force;
- braking power;
- braking impulse;
- approach velocity and momentum.
The ADA test can help sport scientists, strength and conditioning coaches and rehabilitation professionals assess an athlete’s braking capacity, monitor changes over time and guide deceleration-focused training. However, its results depend heavily on the approach distance, entry velocity and data-processing method used.
2- How Approach Distance Changes Deceleration Demands
The strongest direct evidence indicates that the Acceleration-Deceleration Ability test is sensitive to moderate changes in performance. However, this sensitivity varies depending on the sprint approach distance used (Chen et al., 2024).
When comparing 5 m, 10 m and 20 m approaches:
- most kinematic and kinetic metrics can reliably detect changes in horizontal deceleration performance;
- distance to stop and time to stop become less sensitive during the 20 m ADA test;
- shorter approaches create a tighter and more manageable braking window;
- longer approaches increase entry velocity, momentum and the mechanical demands of the task.
With 5 m and 10 m approaches, athletes enter the deceleration phase with less forward momentum. This may allow them to reproduce their movement strategy more consistently between testing sessions.
In contrast, a 20 m approach allows athletes to reach a higher entry velocity and generate greater momentum. This changes the mechanical and neuromuscular demands of the task and may introduce more variability into certain performance outcomes (Philipp et al., 2023).
This does not mean that the 20 m ADA test has no value. Each approach distance provides different information:
- 5 m: assesses deceleration following a short acceleration phase, with lower entry velocity and momentum;
- 10 m: provides a balance between meaningful acceleration and a relatively controlled braking task;
- 20 m: assesses horizontal deceleration under higher-speed and higher-momentum conditions.
The 20 m protocol should therefore be considered a distinct testing condition rather than a more complete version of the shorter ADA tests.
Across the wider literature, the sensitivity of deceleration metrics is influenced by:
- sprint approach distance;
- entry velocity and momentum;
- tracking technology;
- data-processing methods (Harper et al., 2025; Simperingham et al., 2019).
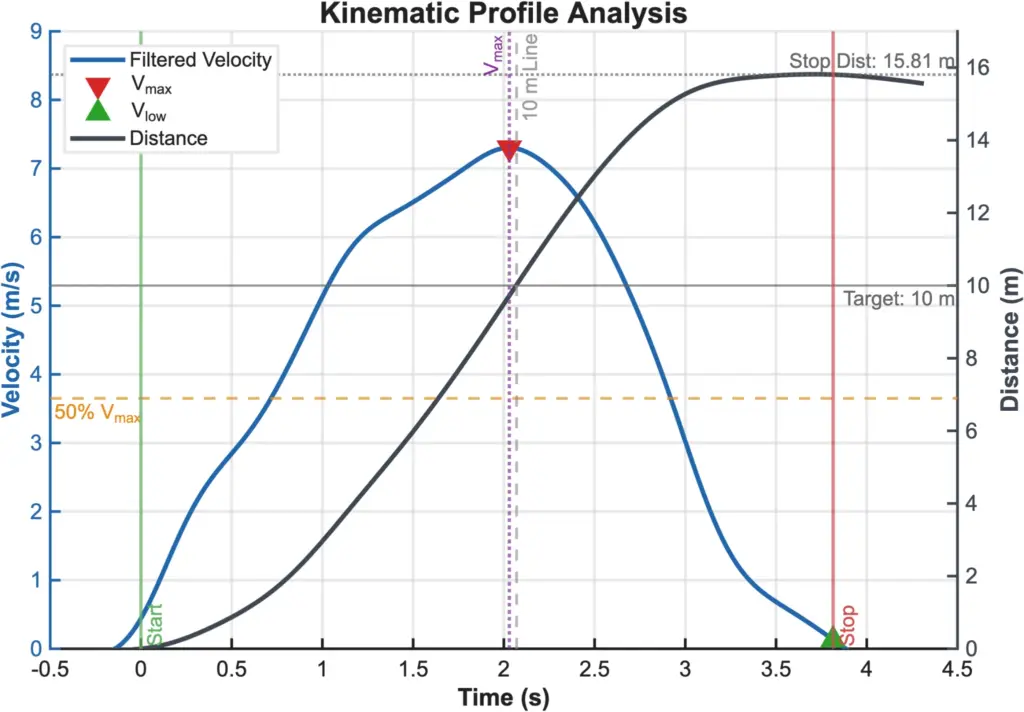
Figure 1. Example velocity–distance curve from a 10–5 ADA test.
3- Which Deceleration Metrics Transfer Across Distances?
Can an athlete’s performance in a 20 m ADA test be predicted from a 5 m test? The answer depends on the variable being measured.
There is a clear distinction between how kinetic variables, which describe force production, and kinematic variables, which describe movement through time and space, behave across different approach distances.
Kinetic Metrics Transfer More Consistently
Kinetic variables generally show large to very large correlations across 5 m, 10 m, and 20 m ADA tests (Chen et al., 2024). These include:
- average horizontal braking force;
- horizontal braking power;
- horizontal braking impulse.
These relationships suggest that an athlete’s force-production strategy remains closely related across different approach distances. Kinetic metrics may therefore provide useful anchors when monitoring horizontal deceleration performance across varying conditions.
Some Kinematic Metrics Are More Distance-Dependent
Kinematic variables include:
- average and peak deceleration;
- distance to stop;
- time to stop;
- approach velocity.
Although average deceleration can remain relevant across protocols, distance to stop and time to stop transfer less consistently. In particular, results obtained during a 5 m ADA test show only small-to-moderate, non-significant relationships with those recorded over 10 m and 20 m (Chen et al., 2024).
This means that an athlete who stops quickly and within a short distance after a 5 m approach will not necessarily demonstrate the same advantage after a 20 m sprint. These outcomes are strongly influenced by entry velocity, momentum and the specific demands of each protocol.
For longitudinal monitoring, practitioners should therefore:
- interpret each metric within the context of the approach distance;
- prioritize kinetic variables when comparing force-production strategies;
- avoid directly comparing stopping time or stopping distance across different protocols;
- use the same distance and testing conditions at every assessment.
4- Neuromuscular Qualities Behind Horizontal Deceleration
The differences observed between ADA test distances are also reflected in the neuromuscular qualities associated with deceleration performance.
Braking demands change alongside the approach distance, entry velocity, and momentum. As a result, the physical qualities contributing to performance during a 5 m ADA test may not be identical to those required after a 10 m or 20 m sprint.
Research has highlighted that:
- eccentric knee extensor strength is associated with deceleration performance in both 5 m and 10 m protocols;
- ankle plantarflexor strength is related to average deceleration specifically during the ultra-short 5 m condition;
- higher approach velocities increase the force-absorption demands placed on the lower limbs;
- each sprint distance produces a distinct speed–acceleration profile and mechanical challenge (Chen et al., 2025).
The greater contribution of the ankle plantarflexors during the 5 m ADA test may reflect the specific demands of transitioning rapidly from early acceleration into deceleration. At longer distances, athletes reach higher velocities and rely on different braking strategies to manage the resulting momentum.
As observed in short-sprint acceleration profiling, shorter distances can also produce less stable split outcomes and unique speed–acceleration relationships (Simperingham et al., 2019; Šťastný et al., 2023).
These findings reinforce an important principle: changing the approach distance changes the physical qualities being assessed. A 5 m, 10 m, and 20 m ADA test should therefore be treated as related but distinct deceleration tasks.
5- Practical Takeaways for High-Performance Environments
If you are integrating ADA tracking into your testing battery, keep these four evidence-based constraints in mind:
- Prioritize Kinetics over Kinematics: Force and impulse metrics are your most consistent anchors across sessions and varying protocols. Kinematic markers (like stopping distance) are highly volatile.
- Shorten the Runway: For the cleanest longitudinal tracking data, lean heavily on 5 m and 10 m protocols. They provide better reliability and sensitivity due to more manageable entry momentum.
- Control Your Processing Pipeline: Processing matters. Radar-derived ADA metrics can vary significantly depending on who analyzes the data, with inter-rater intraclass correlation coefficients (ICCs) fluctuating between 0.56 and 0.91 (Philipp et al., 2024). Standardize your software filters and analysis steps.
- Do Not Interchange Protocols: A 5 m, 10 m, and 20 m deceleration test are related, but they are not interchangeable (Philipp et al., 2023; Harper et al., 2025). Changing the approach distance changes the physical qualities you are testing. Pick a protocol, normalize it, and stick to it.
6- FAQ: Acceleration-Deceleration Ability Test
What is the Acceleration-Deceleration Ability test?
The Acceleration-Deceleration Ability test, or ADA test, assesses an athlete’s ability to rapidly reduce forward velocity after a maximal linear sprint. It can provide information about average deceleration, stopping time, stopping distance, and braking kinetics.
What is the best approach distance for an ADA test?
There is no single best distance for every situation. The protocol should reflect the objective of the assessment:
- 5 m: for deceleration following a short acceleration phase;
- 10 m: for balancing meaningful entry velocity with a controlled braking task;
- 20 m: for assessing deceleration under higher-speed and higher-momentum conditions.
Are shorter ADA tests more reliable?
Most metrics measured during 5 m, 10 m and 20 m ADA tests show good reliability and sensitivity. However, stopping distance and time to stop are less sensitive during the 20 m protocol. Shorter approaches may therefore offer more controlled conditions for longitudinal monitoring (Chen et al., 2024).
Which metrics should be monitored during an ADA test?
The most relevant metrics include:
- approach velocity and momentum;
- average and peak deceleration;
- time to stop;
- distance to stop;
- horizontal braking force;
- braking power;
- braking impulse.
The selection should depend on whether the objective is to assess the outcome of the movement, the athlete’s braking strategy or changes over time.
How can the ADA test be used in athlete monitoring?
The ADA test can help practitioners:
- establish an athlete’s deceleration profile;
- monitor changes following training;
- identify strengths and limitations in braking performance;
- compare performance across testing sessions;
- guide deceleration-focused training programs.
7- References
- Chen Z, Lyu M, Yin M, Deng S, Bishop C, Harper D, Dai B, Li Y. Test-Retest Reliability and Sensitivity of Kinematic and Kinetic Metrics Measured from Horizontal Deceleration Ability Tests with Different Sprinting Distances. J Hum Kinet. 2024 Dec 6;95:5-16. doi: 10.5114/jhk/189659. PMID: 39944965; PMCID: PMC11812162.
- Chen, Z., Gu, Z., Lyu, M., Bishop, C., Harper, D. J., & Li, Y. (2025). Relationships between knee and ankle strength and horizontal deceleration performance at different sprint distances in multi-directional sports athletes. Sports Biomechanics, 1–14.
- Harper, D. J., Carling, C., & Kiely, J. (2020). Measuring maximal horizontal deceleration ability using radar technology: Reliability and sensitivity of kinematic and kinetic variables. Sports Biomechanics, 21(1), 1–18.
- Harper, D. J., Philipp, N. M., Eriksrud, O., Jones, P. A., Graham-Smith, P., & Dos’Santos, T. (2025). Assessing deceleration performance: Methodological and practical considerations. Sports Medicine, 56(1), 1–22.
- Philipp, N. M., Mitchell, S. R., & Fry, A. C. (2023). Horizontal deceleration performance profiles in collegiate court and field athletes. Journal of Strength and Conditioning Research, 37(12), 2415–2422.
- Philipp, N. M., et al. (2024). Inter-rater reliability and data processing filters when evaluating horizontal deceleration kinetics via tracking software.
- Simperingham, K. D., Cronin, J. B., & Ross, A. (2019). Reliability of horizontal force-velocity-power profiling during short sprint-running accelerations using radar technology. Journal of Strength and Conditioning Research, 33(6), 1544–1552.
- Šťastný, P., Silva, A. M., & Nakamura, F. Y. (2023). Comparison of match accelerations and decelerations using continuous absolute and relative thresholds in elite youth soccer players. International Journal of Sports Physiology and Performance, 18(9), 1012–1020.


